Plot Tile and Tiling Pattern
tilePlotter.Rdplot is used for plot pattern or tessellation outputs. In fact it is ggplot-based function that uses geom_sf to plot sf class object.
tilePlotter(
  shape,
  tileColor = NULL,
  fill = "area",
  lineColor = "black",
  borderSize = 0.5,
  borderColor = "white"
)
Arguments
| shape | pattern or tessellation function outputs. It is sf class object. |
|---|---|
| tileColor | if the shape is a polygon, for coloring its regions you can set tileColor, which is a vector of colors equal to the number of regions. |
| fill | is the name of shape sf column and default value is "area". If you can color shape regions base of region code you can set it "name" |
| lineColor | for coloring the shape of a class of polyline |
| borderSize | the size of lines |
| borderColor | the color of shape's border of a class of polygon |
Value
ggplot objects
Examples
library(ggplot2) tile <- motif(theta = 45, delta = 0.5, polyLine = T) tilePlotter(tile) #> Coordinate system already present. Adding new coordinate system, which will replace the existing one.tiling <- tiling(tile, n = 5) tilePlotter(tiling) #> Coordinate system already present. Adding new coordinate system, which will replace the existing one.
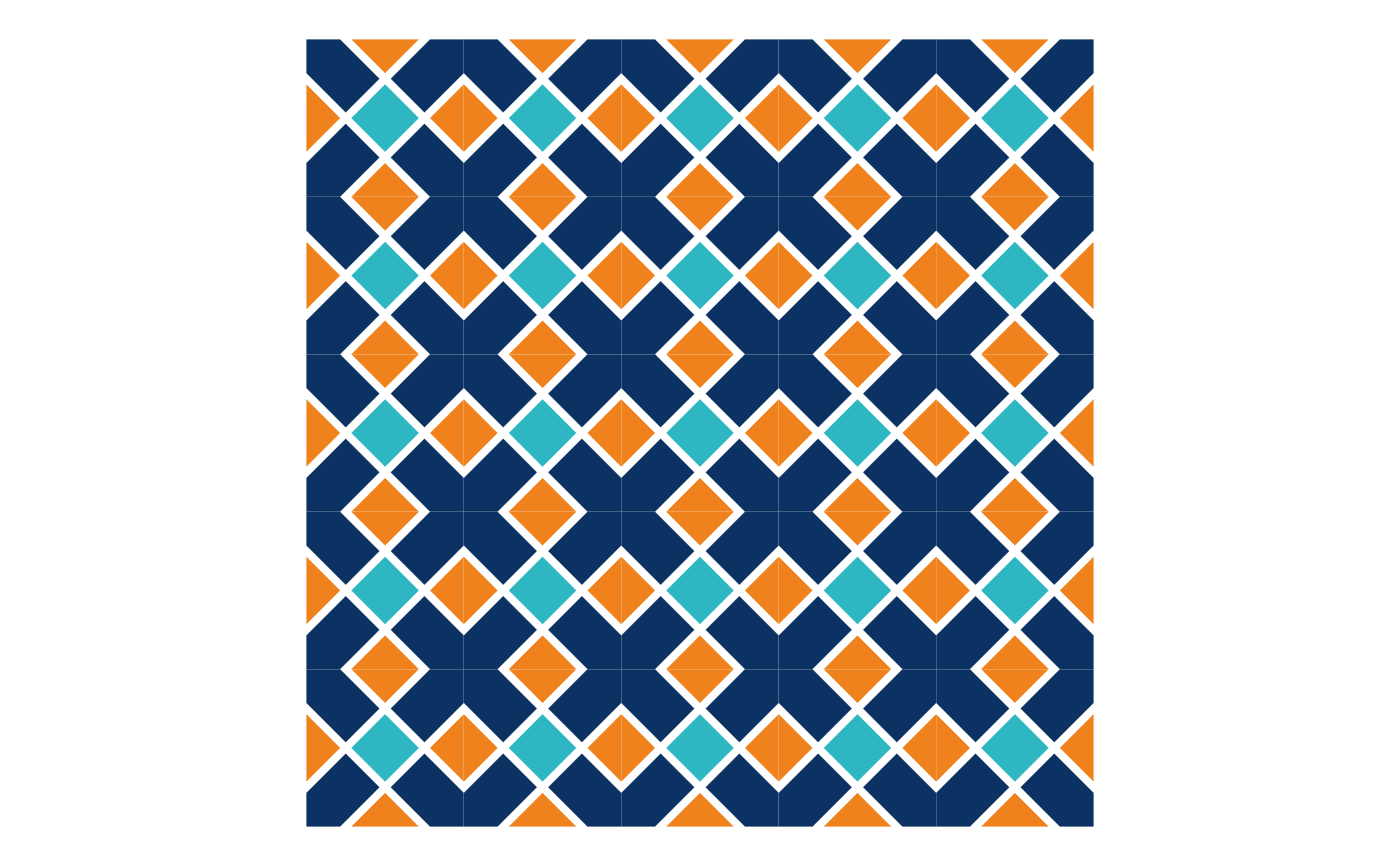
tile <- motif(theta = 45, delta = 0.5, dist = 0.05, polyLine = F) tiling <- tiling(tile, n = 5) tilePlotter(tiling,tileColor = c("#EF821D","#2eb6c2","#0C3263"),borderSize = 0.01) #> Coordinate system already present. Adding new coordinate system, which will replace the existing one.